The Mobilize technology suite provides the innovative instructional open-source platform necessary for teachers to engage their classes in computational and statistical thinking through various data investigation activities, such as asking statistical questions and collecting, analyzing, and interpreting data. The technology is designed around the concept of Participatory Sensing(PS), through which students use mobile devices to collect data about themselves and their communities. Specifically, the software suite provides hands-on methods for students to ask statistical questions by designing their own PS campaigns, collect data using mobile devices, and use various visualization tools to analyze and interpret their data. Class and data management tools are also provided for teachers to fully manage their classrooms.
Since Spring 2012, the Mobilize curricula and technology have been deployed in over 300 LAUSD classrooms, and 5,000+ active users with over 80,000 submitted survey responses. We summarize the key software components and how to get started on the technology below.
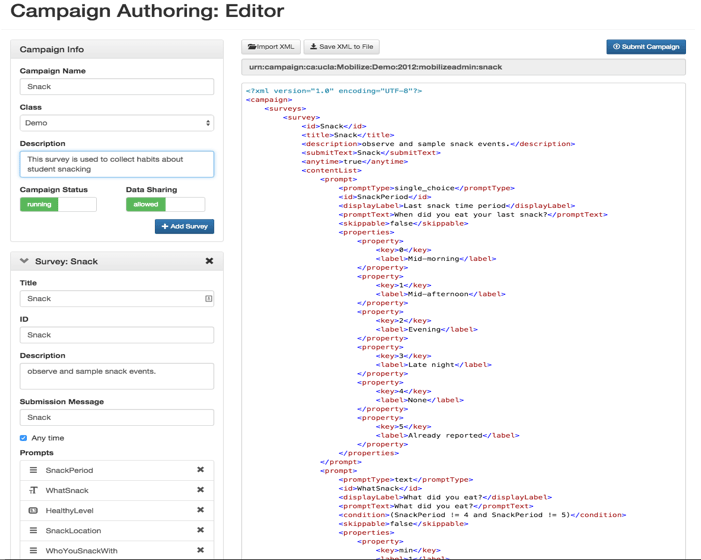
- Campaign Authoring Tool
The tool provides an interface for teachers and students to create data collection projects through a rich set of question types including text, number, single-/multiple- choice (with an option for participants to define their own choices), and multimedia for capturing or uploading images, audios, or videos. While composing a project, the corresponding XML script is also dynamically displayed. Project authors can set up, monitor, and manage incoming data. In the 3- to 5-week Mobilize Algebra I and Biology units, canonical campaigns are pre-created for the students, while in the yearlong Introduction to Data Science (IDS) course; students are expected to create their own campaigns.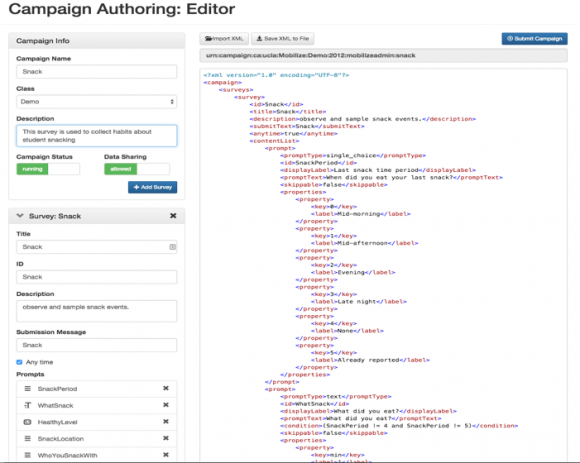
Project Authoring Tool. Project authors create a data collection project (or campaign) by defining the survey structure and questions. A corresponding XML is displayed for students to investigate the detailed script.
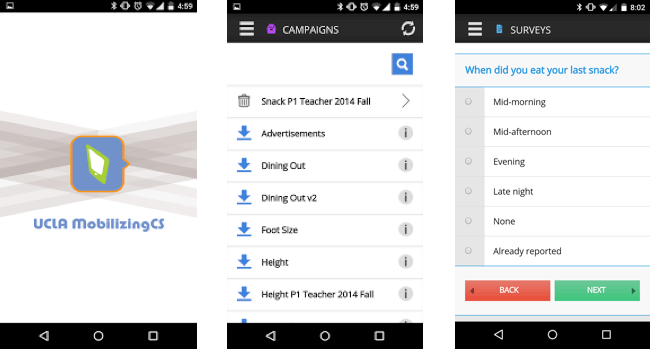
- Mobile Data Collection App
The “UCLA MobilizingCS” app is a cross-platform mobile application available in the Android and Apple stores. Once installed, users can download the data collection projects and start collecting data. The app supports offline operations allowing users to collect data anywhere and anytime. A temporal reminder prompts users to take surveys that fit their schedules. Survey responses are automatically time-stamped and optionally geocoded. A generic web-based application with limited capability (e.g. no multimedia capturing or reminder features) is available for users without mobile devices. The data collection activity is written into all Mobilize curricula for students to collect and later analyze their own data.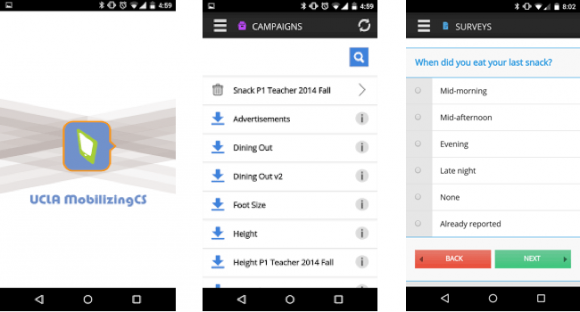
UCLA MobilizingCS mobile app, the cross-platform mobile data collection app that prompt users to enter the data based on the campaign definition.
- Data Analysis and Visualization
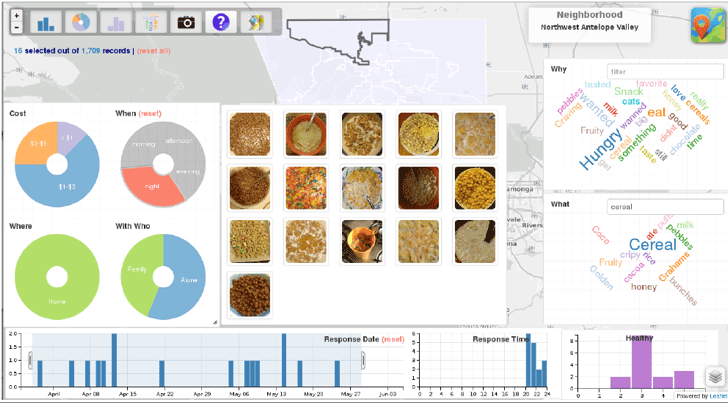
Mobilize provides tools that facilitate exploration and visualization of multivariate datasets. These tools vary based on its interactivity and complexity.- The Interactive Dashboard uses a set of tailored graphs (pie charts, bar plots, maps, wordcloud, image pane) to represent different survey questions. Users can directly interact with individual graphs to filter and zoom into the data. Once a filter is applied to a graph, other graphs will be immediately updated accordingly. This tool is incorporated in the Mobilize Algebra I and Biology units for students to easily explore their data.
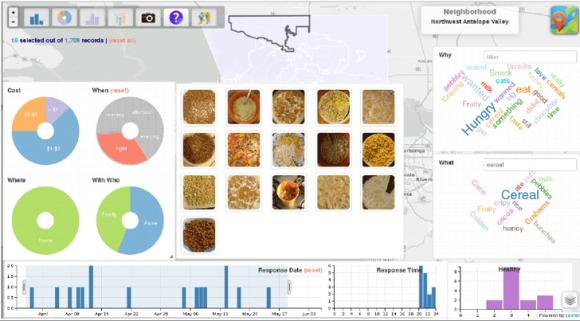
Interactive Dashboard displaying the Snack data. Students can interact with different graph elements to explore their data.
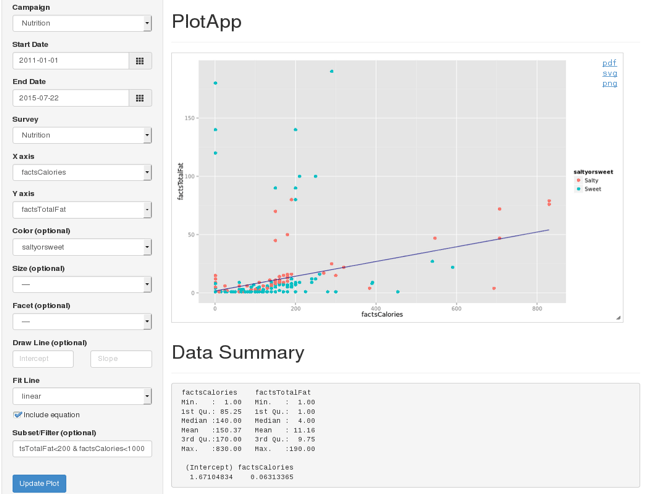
- The PlotApp uses traditional statistical plots (dot, scatter, histogram, bar plots, etc.) to visualize data. Users manipulate the plot composition by choosing different variables for x, y, color-by, and facet-by properties through simple dropdown lists. Different fitting functions such as linear can also be automatically enabled. This tool is incorporated into the Algebra I and IDS curricula to teach linear equation and basic statistics concepts through the simple statistical plot manipulation and visualization.

PlotApp displaying the scatter plot of nutrition data. Students can explore data by experimenting with different plot properties. The plot shows calories vs. fat of snacks colored by whether the snack is salty or sweet. Linear fitted line as well as its equation can also be optionally shown.
- R-based statistical analysis and programming. Students explore, visualize and model data by learning and programming in the R statistical programming language. Mobilize uses RStudio to provide students the online access to our centralized computing platform. In addition, the MobilizR libraries (i.e. a set of functions) were created and incorporated into the IDS curriculum to provide simpler forms of data manipulation and analysis, as well as maintain consistent syntax pattern throughout the lessons. The simplified, unified, and coherent syntax enable students to focus their attention on learning data analysis rather than struggling with syntax.
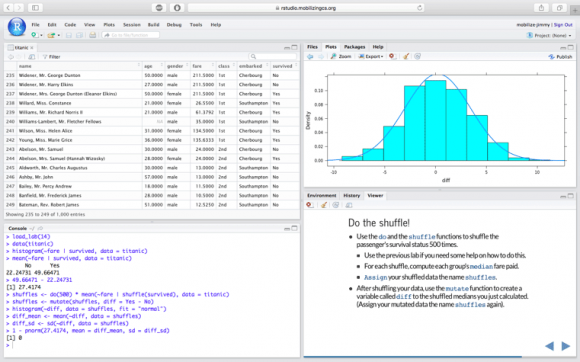
R-based statistical analysis using RStudio. Students can follow the lab instruction displayed in the lower right panel, program their analysis in R using the Mobilize provided functions through the R command console displayed in the lower left panel, and explore the data set and plot displayed in the upper left and right panels, respectively, according to the R commands.
- The Interactive Dashboard uses a set of tailored graphs (pie charts, bar plots, maps, wordcloud, image pane) to represent different survey questions. Users can directly interact with individual graphs to filter and zoom into the data. Once a filter is applied to a graph, other graphs will be immediately updated accordingly. This tool is incorporated in the Mobilize Algebra I and Biology units for students to easily explore their data.
- Class and Data Management
Mobilize tools allow teachers to dynamically setup and manage groups of students, usually their class rosters, that can participate in the data investigation activities. Teachers can also monitor the ongoing data collection activities, control and manage data access by students (e.g. start/stop data collection activities, review and delete inappropriate responses, share/unshare students data, etc.). These feature sets allow teachers to have full control over their classroom needs.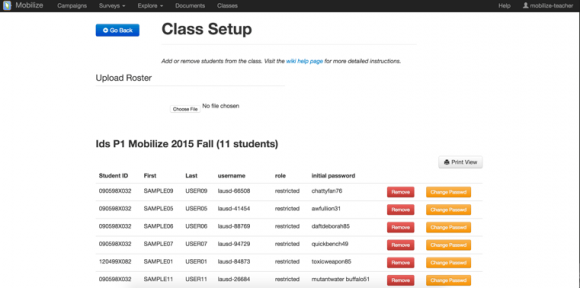
Class management tool allowing teachers to control their class members, and help students resetting their passwords. Student needs to change their passwords upon first login.

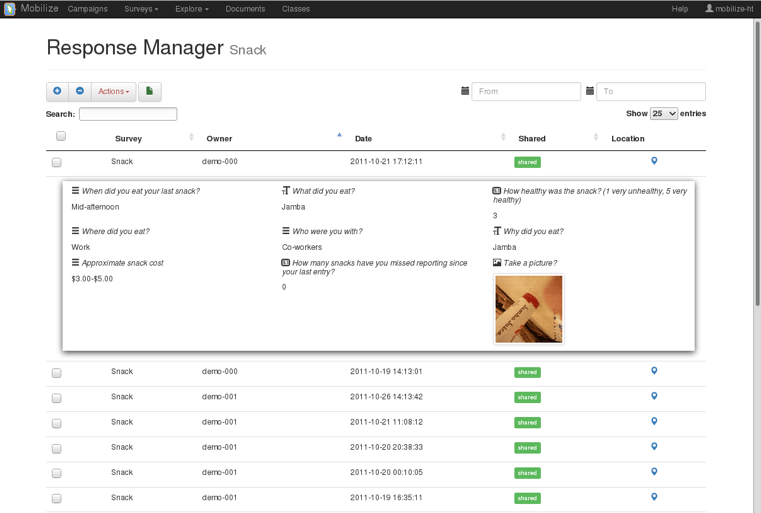
Response Manager allowing teachers to manage students’ survey responses. Teachers can review and delete inappropriate responses or change the response privacy states to allow sharing among class members.


Note: The Mobilize software suite is empowered by the ohmage participatory-sensing platform (ohmage.org), and the ohmageX mobile data collection tool. The Mobilize project is supported by the National Science Foundation under Grant Number 0962919.
The Mobilize technology suite is an essential component for implementing the IDS curriculum. While the technology must be installed at the district level, you can “test drive” the applications.